


Mapping Identity – Visualizing the discourse of identity
‘Identity’ – a term to define ‘uniqueness’ and often seen as a congenitally given property of every human being. Who am I? Is there a simple answer to that question? What defines our identity? Is it our body, our language, our biography, our social role, our gender, our culture or even our nationality that determines our identity? Is it our identity or our differences that make us unique? Striving for identity, should the obsession to exclude the foreign and strange be an ideology we abandon? The scientific discourse debates controversial concepts and perceptions, and reflects the relationship of the self to society from a variety of points of view. Insights taken from philosophy, sociology, psychology, ethnography, anthropology, semiotics and communication science establish a variety of positions that have to be recognized from their distinctive background and understood within their historical framing. Although challenging to enter, this discourse is crucial to understanding within the field of Identity and design. ‘How do identity concepts and models of identity emerge? What is their socio-cultural impact? How do we design Identity now and tomorrow?’ – These are the principal questions of Identity and Design. After some initial introductions to the area of study, the next step was to research the visual representation techniques, through historical examples and self designed forms. It quickly became apparent that visualizations using just one parameter, would not fully represent the complexity of the problem, leading to misrepresentation. The decision was made on an analogue form that, step by step, would enable an entry point to different theories while showing the overall connection of said theories. The following visualized steps were used to delve deeper into the discourse on identity
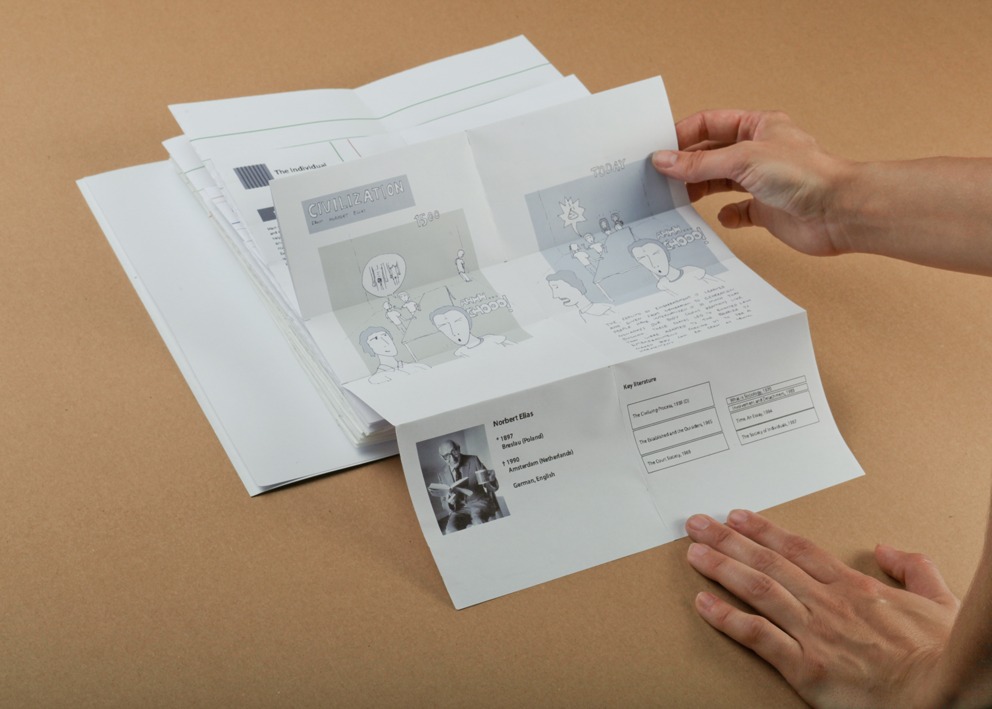
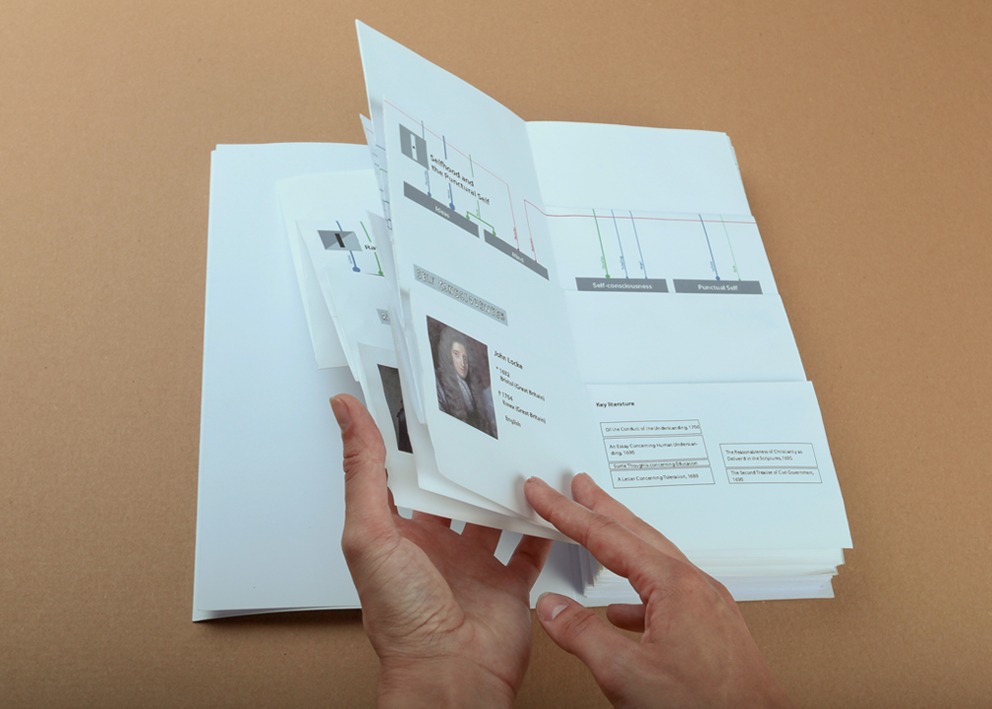
- Short text summaries, quotations and a list of references.
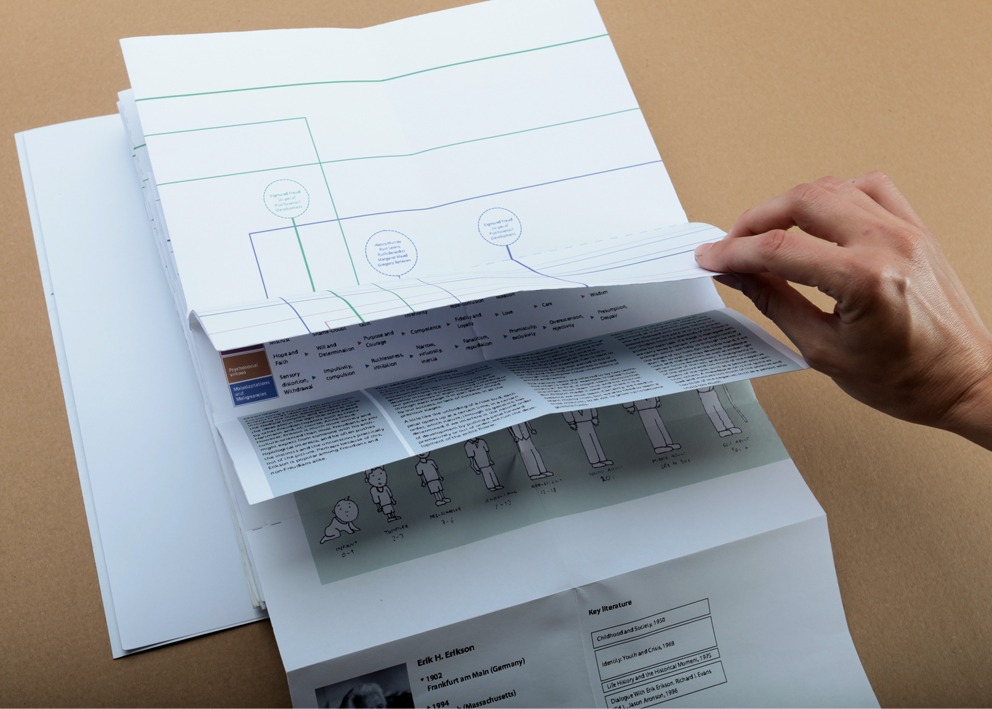
- Narrative illustrations, putting the quintessence of a theory into daily-life situations.
- Schematic infographics, visualizing theoretic models and line of argument.
- Pictograms, allocating theories to major paradigms and polarities.
An additional chronological diagram (timeline) helped to classify and connect the diverse theories. Despite the inclusion of 30 different theories, the map remains incomplete. The visualization had its limitations when demonstrating the theoretical connections and historical events. Nevertheless, visual representations can offer easy access to highly abstract and complex fields – and within the discourse on identity it has been a fun way of understanding the questions of ‘who am I?’.